New mortgage activity revived in October according to the HKMA's monthly survey on residential mortgage lending.
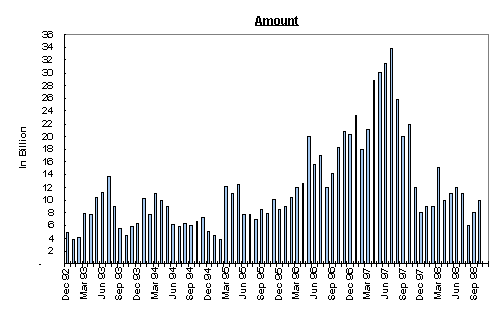
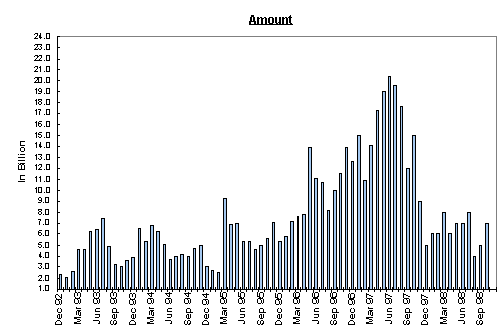
New loans approved during the month rose significantly by 24.2% to $9.9 billion ($8.0 billion in September) mainly as a result of more active primary market activity. Loans approved during the month but not yet drawn also increased significantly by 42.9% from $5.24 billion in September to $7.50 billion in October.
The average loan-to-valuation ratio of these loans was 59.2% (60.2% in September) and the average contractual life was 224 months (227 months in September). 99.4% of these loans were related to owner-occupied properties.
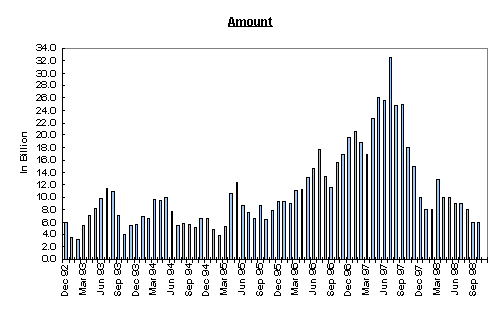
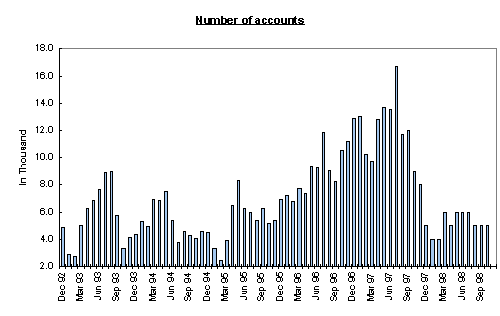
The amount of gross new loans made in October was $6.42 billion which was similar to the September level (compared with the 23.8% decrease in September). The average size of new loans increased to $1.38 million in October from $1.37 million in September.
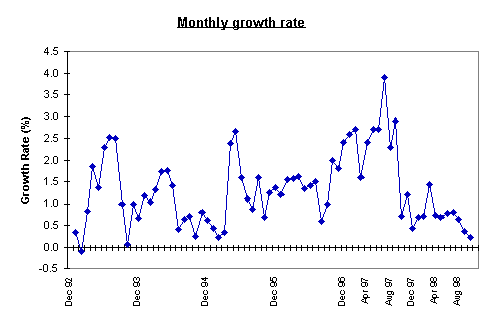
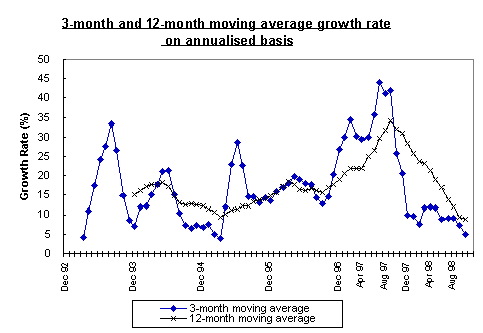
The amount of outstanding mortgage loans increased by 0.22% in October, compared with 0.37% growth in September. The annualised rate of growth of outstanding loans in the three months to October decreased to 4.9% from 7.4% in September. The average change over the last twelve months decreased to 8.8% from 9.4% in September.
The loan delinquency ratio (measured by the ratio of mortgage loans overdue for more than 3 months to total outstanding mortgage loans) was 0.68% as at October 1998 (compared with 0.53% in September).
On the pricing front, mortgage rates eased further with 44% of the new loans granted at the best lending rate plus 0.5% (compared with 21.9% in September).
"While the delinquency ratio on existing mortgage loans remains low on average, the continued increase in the ratio reinforces the need for banks to remain prudent in their new lending as market sentiment improves. They should take care that revived competition for loans, as evidenced by the decline in lending margins, does not lead to a lowering of credit standards. In particular, banks should pay close attention to borrowers' ability to service their debt and should carefully check income proof," said Mr. David Carse, Deputy Chief Executive of the HKMA.
Gross loans for the purchase of properties in Mainland China decreased from $86 million in September to $54 million in October. The amount of outstanding loans decreased slightly by 1.04% to $7.79 billion.
Hong Kong Monetary Authority
27 November 1998
Residential Mortgage Loans in Hong Kong
| Results of Survey for October 1998 |
| |
|
|
|
Oct 98 |
|
Sep 98 |
|
| |
|
|
|
HK$m |
|
HK$m |
|
| 33 Authorised Institutions |
| |
|
|
|
|
|
|
|
| 1. |
Gross new loans made during month |
| |
|
|
|
|
|
|
|
| |
a. |
Amount of new loans |
|
6,416 |
|
6,425 |
|
| |
b. |
Monthly change in amount |
|
-0.1% |
|
-23.8% |
|
| |
c. |
Number of new loans |
|
4,651 |
|
4,677 |
|
| |
d. |
Average size of new loans |
|
1.38 |
|
1.37 |
|
| |
|
|
|
|
|
|
|
| 2. |
New loans approved during month |
| |
|
|
|
|
|
|
|
| |
a. |
Amount of approvals |
|
9,906 |
|
7,979 |
|
| |
b. |
Monthly change in approvals |
|
24.2% |
|
31.3% |
|
| # |
c. |
Number of applications |
|
10,228 |
|
8,187 |
|
| |
d. |
Number of approvals |
|
6,877 |
|
5,646 |
|
| |
e. |
Average size of approvals |
|
1.44 |
|
1.41 |
|
| # |
f. |
Average loan-to-value ratio (%) |
|
59.19 |
|
60.20 |
|
| # |
g. |
Average contractual life (months) |
|
224.00 |
|
227.00 |
|
| # |
h. |
Owner-occupied properties (%) |
|
99.43 |
|
99.47 |
|
| |
|
|
|
|
|
|
|
| |
|
By Property age |
|
|
|
|
|
| |
|
Property age - 15 years or below |
- amount |
9,040 |
|
6,913 |
|
| |
|
|
- number |
6,037 |
|
4,762 |
|
| |
|
Property age - above 15 years |
- amount |
866 |
|
1,065 |
|
| |
|
|
- number |
840 |
|
884 |
|
| |
|
Associated with co-financing schemes |
|
|
|
|
|
| |
|
- amount |
|
2,180 |
|
1,403 |
|
| |
|
- number |
|
1,345 |
|
929 |
|
| |
|
|
|
|
|
|
|
| 3. |
New loans approved during month |
| |
but not yet drawn |
| |
|
|
|
|
|
|
|
| |
a. |
Amount of approvals |
|
7,496 |
|
5,244 |
|
| |
b. |
Number of approvals |
|
5,182 |
|
3,720 |
|
| |
|
|
|
|
|
|
|
| 4. |
Amount of outstanding loans |
| |
|
|
|
|
|
|
|
| |
a. |
Amount of loans |
|
451,725 |
|
451,828 |
|
| |
b. |
Monthly change in loans |
|
0.22% |
* |
0.37% |
|
| |
c. |
Twelve-month change in loans |
|
8.9% |
* |
9.5% |
|
| |
d. |
Average monthly changes over |
|
|
|
|
|
| |
|
last three months (annualized) |
|
4.9% |
* |
7.4% |
|
| |
|
last twelve months (annualized) |
|
8.8% |
* |
9.4% |
|
| |
|
|
|
|
|
|
|
| |
|
Associated with co-financing schemes |
|
|
|
|
|
| |
|
- amount |
|
23,709 |
|
22,214 |
|
| |
|
- number |
|
11,474 |
|
10,537 |
|
| |
|
|
|
|
|
|
|
| |
# |
Delinquency ratio (%) |
|
|
|
|
|
| |
|
- more than 3 months |
|
0.68 |
|
0.53 |
|
| |
|
- more than 6 months |
|
0.22 |
|
0.16 |
|
| |
|
|
|
|
|
|
|
| 5. |
Interest margin on new loans approved during month |
| |
|
|
|
|
|
|
|
| |
a. |
At BLR |
|
0.3% |
|
0.3% |
|
| |
b. |
More than 0% and up to 0.25% above BLR |
|
5.3% |
|
2.7% |
|
| |
c. |
More than 0.25% and up to 0.5% above BLR |
|
44.0% |
|
21.9% |
|
| |
d. |
More than 0.5% and up to 0.75% above BLR |
|
22.6% |
|
34.4% |
|
| |
e. |
More than 0.75%and up to 1% above BLR |
|
11.5% |
|
17.6% |
|
| |
f. |
More than 1% above BLR |
|
9.3% |
|
15.3% |
|
| |
g. |
Others |
|
7.0% |
|
7.8% |
|
| |
|
|
|
|
|
|
|
| * |
Adjusted for the effect of reclassification and sale and purchase of mortgage loans by a number of institutions amounting to $1,085 million. |
| # |
Statistics collected from June 1998 onwards. |
RESIDENTIAL MORTGAGE LOANS IN HONG KONG
(33 institutions)
GROSS NEW LOANS MADE DURING THE MONTH
NEW LOANS APPROVED DURING MONTH
NEW LOANS APPROVED BUT NOT YET DRAWN
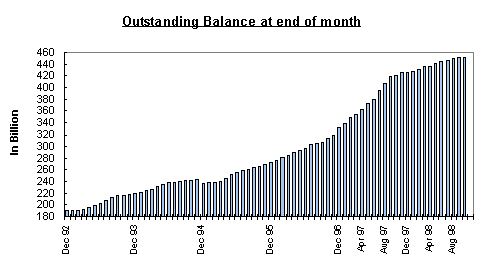
Remarks: The significant fall of outstanding balance in December 1994 was due to the effect of reclassification, securitization and sale of loans by some institutions.