

香港金融管理局(金管局)最新的住宅按揭每月統計調查結果顯示,1998年10月 份新按揭貸款活動轉趨活躍。
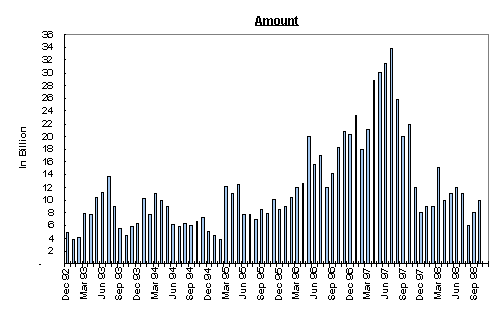
10月份新批出貸款總額顯著增加24.2%,至99億元(9月份為80億元),主 要由於一手市場較為活躍。10月份已批出但未被取用貸款亦大幅增加42.9%,由 9月份的52.4億元增至75億元。
在10月份新批出的按揭貸款中,平均按揭比率為59.2%(9月份為60.2%), 而貸款平均合約期為224個月(9月份為227個月)。新批出貸款中99.4%與 業主自用物業有關。
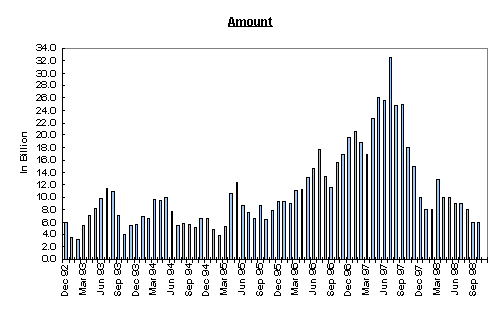
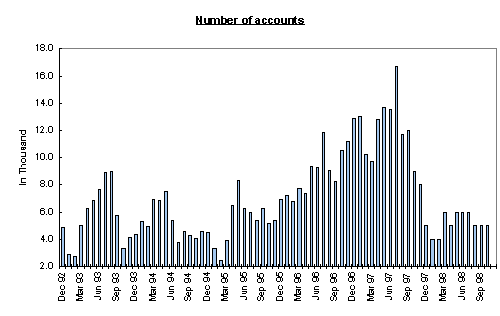
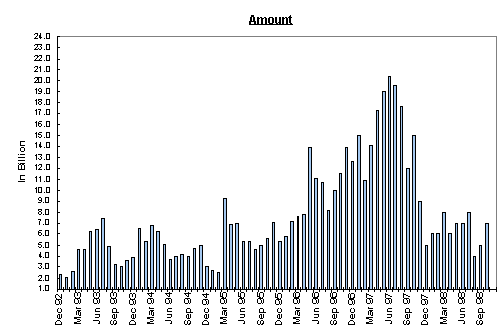
10月份新借出貸款總額為64.2億元,與9月份水平接近(9月份跌幅為23.8%)。 10月份新貸款平均金額為138萬元,較9月份錄得的137萬元有所增加。
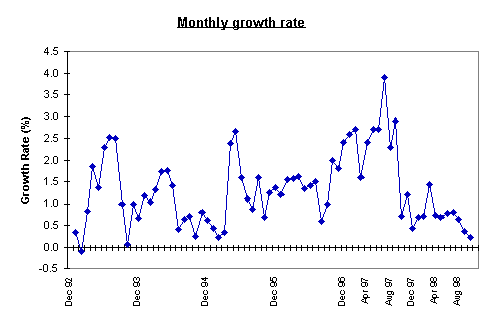
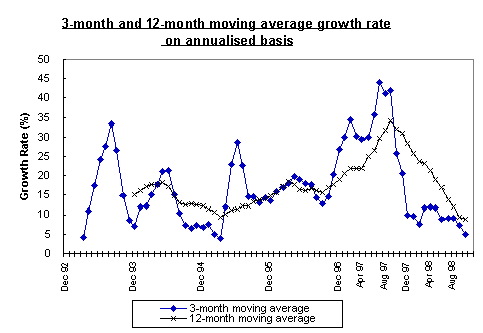
10月份的未償還按揭貸款增加0.22%,9月份增幅則為0.37%。截至10月 底,過去3個月的按年計算未償還貸款增長率由9月份的7.4%,跌至4.9%。過 去12個月的平均增長率則由9月份錄得的9.4%,跌至10月份的8.8%。
截至10月底,按揭貸款拖欠比率(過期3個月以上的按揭貸款佔未償還按揭貸款總額 的比率)為0.68%(9月份為0.53%)。
10月份按揭利率進一步回軟。在新批出貸款中,44%以最優惠利率再加0.5厘的 利率批出(9月份為21.9%)。
金管局副總裁簡達恆說:「雖然以平均計算,現有按揭貸款拖欠比率仍然處於低水平, 但比率持續上升顯示在市場氣氛改善下,銀行更需審慎處理新貸款申請。從按揭利率與 最優惠利率的息差收窄,可見銀行在按揭貸款業務的競爭再度增加,銀行應注意不要為 爭取業務而降低信貸標準。銀行更應審慎注意借款人的還款能力,並小心查核他們的入 息證明。」
10月份用以購買中國內地物業的貸款總額由9月份的8,600萬元,跌至5,400 萬元。未償還貸款總額稍跌1.04%,至77.9億元。
香港金融管理局
1998年11月27日
Residential Mortgage Loans in Hong Kong
|
|||||||
| Oct 98 | Sep 98 | ||||||
| 33 Authorised Institutions | HK$m | HK$m | |||||
| 1. | Gross new loans made during month | ||||||
| a. | Amount of new loans | 6,416 | 6,425 | ||||
| b. | Monthly change in amount | -0.1% | -23.8% | ||||
| c. | Number of new loans | 4,651 | 4,677 | ||||
| d. | Average size of new loans | 1.38 | 1.37 | ||||
| 2. | New loans approved during month | ||||||
| a. | Amount of approvals | 9,906 | 7,979 | ||||
| b. | Monthly change in approvals | 24.2% | 31.3% | ||||
| # | c. | Number of applications | 10,228 | 8,187 | |||
| d. | Number of approvals | 6,877 | 5,646 | ||||
| e. | Average size of approvals | 1.44 | 1.41 | ||||
| # | f. | Average loan-to-value ratio (%) | 59.19 | 60.20 | |||
| # | g. | Average contractual life (months) | 224.00 | 227.00 | |||
| # | h. | Owner-occupied properties (%) | 99.43 | 99.47 | |||
| By Property age | |||||||
| Property age - 15 years or below | - amount | 9,040 | 6,913 | ||||
| - number | 6,037 | 4,762 | |||||
| Property age - above 15 years | - amount | 866 | 1,065 | ||||
| - number | 840 | 884 | |||||
| Associated with co-financing schemes | |||||||
| - amount | 2,180 | 1,403 | |||||
| - number | 1,345 | 929 | |||||
| 3. | New loans approved during month | ||||||
| but not yet drawn | |||||||
| a. | Amount of approvals | 7,496 | 5,244 | ||||
| b. | Number of approvals | 5,182 | 3,720 | ||||
| 4. | Amount of outstanding loans | ||||||
| a. | Amount of loans | 451,725 | 451,828 | ||||
| b. | Monthly change in loans | 0.22% | * | 0.37% | |||
| c. | Twelve-month change in loans | 8.9% | * | 9.5% | |||
| d. | Average monthly changes over | ||||||
| last three months (annualized) | 4.9% | * | 7.4% | ||||
| last twelve months (annualized) | 8.8% | * | 9.4% | ||||
| Associated with co-financing schemes | |||||||
| - amount | 23,709 | 22,214 | |||||
| - number | 11,474 | 10,537 | |||||
| # | Delinquency ratio (%) | ||||||
| - more than 3 months | 0.68 | 0.53 | |||||
| - more than 6 months | 0.22 | 0.16 | |||||
| 5. | Interest margin on new loans approved during month | ||||||
| a. | At BLR | 0.3% | 0.3% | ||||
| b. | More than 0% and up to 0.25% above BLR | 5.3% | 2.7% | ||||
| c. | More than 0.25% and up to 0.5% above BLR | 44.0% | 21.9% | ||||
| d. | More than 0.5% and up to 0.75% above BLR | 22.6% | 34.4% | ||||
| e. | More than 0.75%and up to 1% above BLR | 11.5% | 17.6% | ||||
| f. | More than 1% above BLR | 9.3% | 15.3% | ||||
| g. | Others | 7.0% | 7.8% | ||||
| * | Adjusted for the effect of reclassification and sale and purchase of mortgage loans by a number of institutions amounting to $1,085 million. | ||||||
| # | Statistics collected from June 1998 onwards. | ||||||
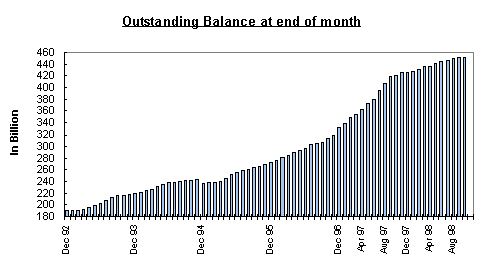
Remarks: The significant fall of outstanding balance in December 1994 was due to the effect of reclassification, securitization and sale of loans by some institutions.