Mortgage activity continued to moderate in August according to
the HKMA's monthly survey on residential mortgage lending.
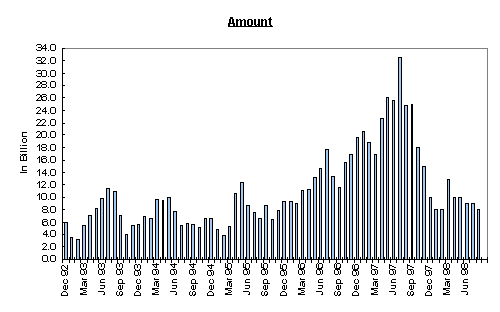
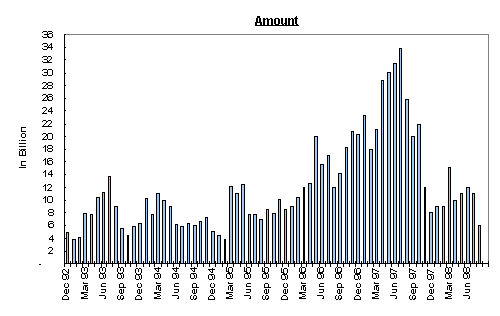
The amount of gross new loans made fell by 9.5% from $9.31
billion in July to $8.43 billion in August (compared with the 0.7%
decrease in July). The average size of new loans increased to $1.62
million in August from $1.60 million in July.
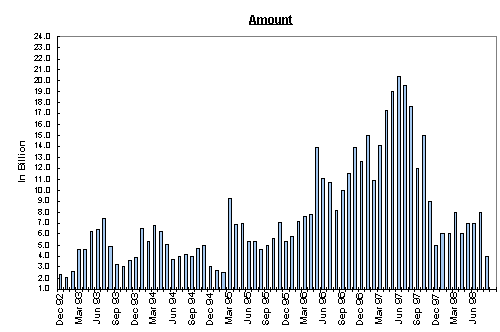
New loans approved during the month dropped significantly by
42.1% to $6.1 billion ($10.5 billion in July), reflecting the low
level of transactions in July and August. Loans approved during the
month but not yet drawn fell by 52.3% from $7.83 billion in July to
$3.73 billion in August.
With regard to the new loans approved during August, the average
loan-to-valuation ratio of these loans was 58% (60% in July) and
the average contractual life was 217 months (226 months in July).
99.2% of these loans were related to owner-occupied properties.
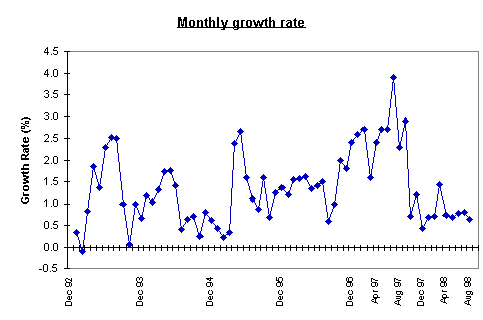
The amount of outstanding mortgage loans increased by 0.64% in
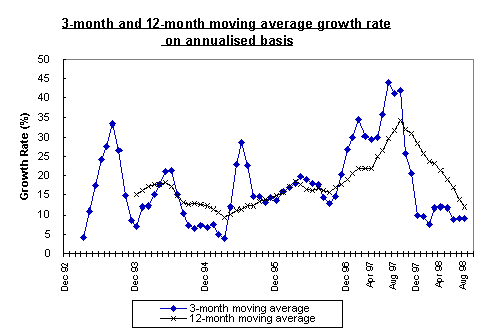
August, compared with 0.81% growth in July. The annualised rate of
growth of outstanding loans in the three months to August decreased
to 9.1% from 9.2% in July. The average change over the last twelve
months decreased to 12.0% from 13.7% in July.
As expected, the loan delinquency ratio (measured by the ratio
of mortgage loans overdue for more than 3 months to total
outstanding mortgage loans) continued to rise in August, reaching
0.44% (compared with 0.34% in July). However, the overall quality
of the mortgage portfolio remains good.
On the pricing front, mortgage rates eased slightly with only
29.7% of new loans granted at more than 1% above best lending rate
(compared with 33.8% in June).
"Although primary market activity revived in September, new
lending is expected to remain subdued," said Mr. David Carse,
Deputy Chief Executive of the HKMA.
Gross loans for the purchase of properties in Mainland China
decreased from $116 million in July to $100 million in August. The
amount of outstanding loans increased slightly by 0.75% to $7.92
billion.
Hong Kong Monetary Authority
23 September 1998
Residential Mortgage Loans in Hong Kong
| Results of
Survey for August 1998 |
|
|
|
|
Aug-98 |
|
Jul-98 |
|
|
|
|
HK$m |
|
HK$m |
| 33 Authorised
Institutions |
|
|
|
|
|
|
|
| 1. |
Gross new loans
made during month |
|
|
|
|
|
|
|
|
a. |
Amount of new loans |
|
8,427 |
|
9,314 |
|
b. |
Monthly change in amount |
|
-9.5% |
|
-0.7% |
|
c. |
Number of new loans |
|
5,205 |
|
5,831 |
|
d. |
Average size of new loans |
|
1.62 |
|
1.60 |
|
|
|
|
|
|
|
| 2. |
New loans
approved during month |
|
|
|
|
|
|
|
|
a. |
Amount of approvals |
|
6,079 |
|
10,505 |
|
b. |
Monthly change in approvals |
|
-42.1% |
|
-9.1% |
| # |
c. |
Number of applications |
|
4,710 |
|
7,788 |
|
d. |
Number of approvals |
|
4,055 |
|
6,559 |
|
e. |
Average size of approvals |
|
1.50 |
|
1.60 |
| # |
f. |
Average loan-to-value ratio (%) |
|
58.06 |
|
60.08 |
| # |
g. |
Average contractual life (months) |
|
217.00 |
|
226.00 |
| # |
h. |
Owner-occupied properties (%) |
|
99.23 |
|
99.30 |
|
|
|
|
|
|
|
|
|
By Property age |
|
|
|
|
|
|
Property age - 15 years or below |
- amount |
5,193 |
|
9,408 |
|
|
|
- number |
3,268 |
|
5,605 |
|
|
Property age - above 15 years |
- amount |
886 |
|
1,097 |
|
|
|
- number |
787 |
|
954 |
|
|
Associated with co-financing
schemes |
|
|
|
|
|
|
- amount |
|
375 |
|
1,236 |
|
|
- number |
|
208 |
|
611 |
|
|
|
|
|
|
|
| 3. |
New loans approved during
month |
|
but not yet
drawn |
|
|
|
|
|
|
|
|
a. |
Amount of approvals |
|
3,731 |
|
7,827 |
|
b. |
Number of approvals |
|
2,516 |
|
4,712 |
|
|
|
|
|
|
|
| 4. |
Amount of
outstanding loans |
|
|
|
|
|
|
|
|
a. |
Amount of loans |
|
450,124 |
|
447,240 |
|
b. |
Monthly change in loans |
|
0.64% |
* |
0.81% |
|
c. |
Twelve-month change in loans |
|
12.1% |
* |
14.0% |
|
d. |
Average monthly changes over |
|
|
|
|
|
|
last three months (annualized) |
|
9.1% |
* |
9.2% |
|
|
last twelve months (annualized) |
|
12.0% |
* |
13.7% |
|
|
|
|
|
|
|
|
|
Associated with co-financing
schemes |
|
|
|
|
|
|
- amount |
|
21,450 |
|
20,608 |
|
|
- number |
|
10,001 |
|
9,597 |
|
|
|
|
|
|
|
|
# |
Delinquency ratio
(%) |
|
|
|
|
|
|
- more than 3 months |
|
0.44 |
|
0.34 |
|
|
- more than 6 months |
|
0.12 |
|
0.10 |
|
|
|
|
|
|
|
| 5. |
Interest margin
on new loans approved during month |
|
|
|
|
|
|
|
|
a. |
At BLR |
|
0.6% |
|
0.3% |
|
b. |
More than 0% and up to 0.25% above BLR |
|
0.5% |
|
1.0% |
|
c. |
More than 0.25% and up to 0.5% above BLR |
|
6.9% |
|
14.8% |
|
d. |
More than 0.5% and up to 0.75% above BLR |
|
25.4% |
|
15.9% |
|
e. |
More than 0.75%and up to 1% above BLR |
|
27.2% |
|
25.2% |
|
f. |
More than 1% above BLR |
|
29.7% |
|
33.8% |
|
g. |
Others |
|
9.7% |
|
9.0% |
|
|
|
|
|
|
|
| * |
Adjusted for the effect of reclassification by a
number of institutions amounting to $2 million. |
|
|
|
|
|
|
|
| # |
Statistics collected from June 1998 onwards. |
RESIDENTIAL MORTGAGE LOANS IN HONG KONG
(33 institutions)
GROSS NEW LOANS MADE DURING THE MONTH
NEW LOANS APPROVED DURING MONTH
NEW LOANS APPROVED BUT NOT YET DRAWN
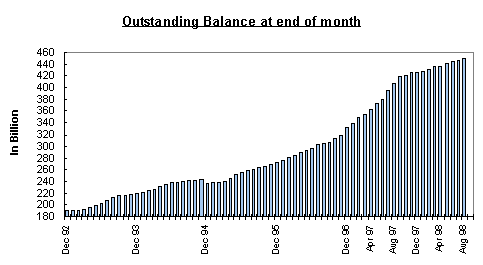
Remarks: The significant fall of outstanding balance in
December 1994 was due to the effect of reclassification,
securitization and sale of loans by some institutions.
