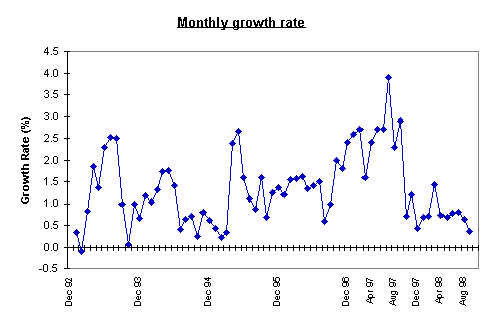
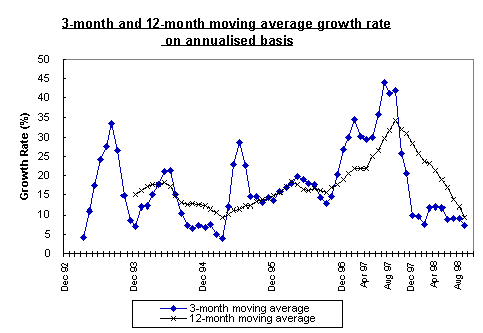
Mortgage activity continued to moderate in September according
to the HKMA's monthly survey on residential mortgage lending.
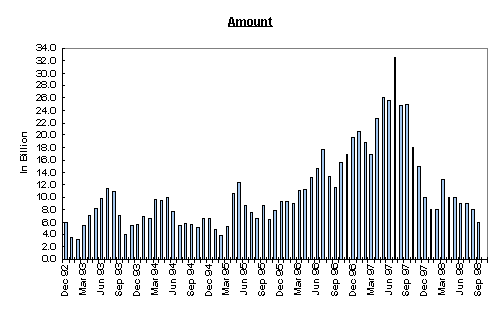
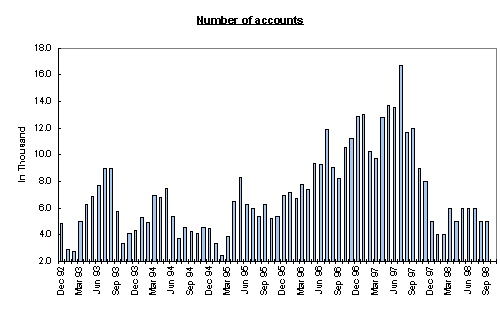
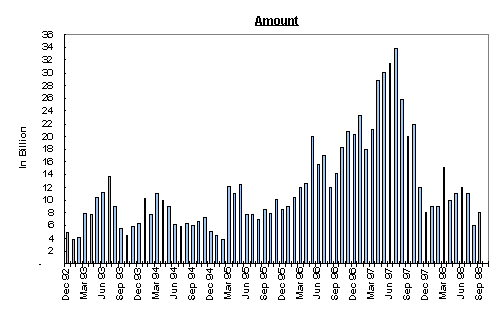
The amount of gross new loans made fell by 23.8% from $8.43
billion in August to $6.43 billion in September (compared with the
9.5% decrease in August). The average size of new loans decreased
to $1.37 million in September from $1.62 million in August.
New loans approved during the month, however, rose significantly
by 31.3% to $8.0 billion ($6.1 billion in August) mainly as a
result of primary market activities in September. Loans approved
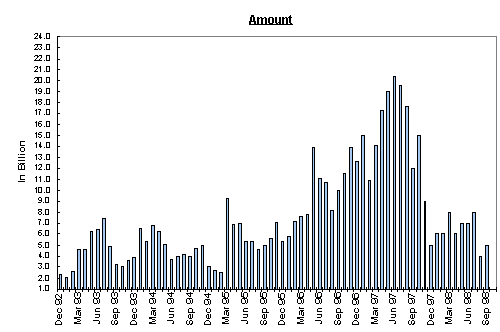
during the month but not yet drawn also increased considerably by
40.6% from $3.73 billion in August to $5.24 billion in
September.
With regard to the new loans approved during September, the
average loan-to-valuation ratio of these loans was 60.2% (58% in
August) and the average contractual life was 227 months (217 months
in August). 99.5% of these loans were related to owner-occupied
properties.
The amount of outstanding mortgage loans increased by 0.37% in
September, compared with 0.64% growth in August. The annualised
rate of growth of outstanding loans in the three months to
September decreased to 7.4% from 9.1% in August. The average change
over the last twelve months decreased to 9.4% from 12.0% in
August.
The loan delinquency ratio (measured by the ratio of mortgage
loans overdue for more than 3 months to total outstanding mortgage
loans) was 0.53% at end-September 1998 (compared with 0.44% in
August).
On the pricing front, mortgage rates eased further with only
15.3% of new loans granted at more than 1% above best lending rate
(compared with 29.7% in August).
"Although market sentiment has improved recently, mortgage loan
growth is expected to remain at a moderate level," said Mr. Y K
Choi, Acting Deputy Chief Executive of the HKMA.
Gross loans for the purchase of properties in Mainland China
decreased from $100 million in August to $86 million in September.
The amount of outstanding loans decreased slightly by 0.60% to
$7.88 billion.
Hong Kong Monetary Authority
23 October 1998
Residential Mortgage Loans in Hong Kong
| Results of
Survey for September 1998 |
|
|
|
|
Sep
98 |
|
Aug
98 |
|
|
|
|
|
HK$m |
|
HK$m |
|
| 33 Authorised
Institutions |
|
|
|
|
|
|
|
|
| 1. |
Gross new loans
made during month |
|
|
|
|
|
|
|
|
|
a. |
Amount of new loans |
|
6,425 |
|
8,427 |
|
|
b. |
Monthly change in amount |
|
-23.8% |
|
-9.5% |
|
|
c. |
Number of new loans |
|
4,677 |
|
5,205 |
|
|
d. |
Average size of new loans |
|
1.37 |
|
1.62 |
|
|
|
|
|
|
|
|
|
| 2. |
New loans
approved during month |
|
|
|
|
|
|
|
|
|
a. |
Amount of approvals |
|
7,979 |
|
6,079 |
|
|
b. |
Monthly change in approvals |
|
31.3% |
|
-42.1% |
|
| # |
c. |
Number of applications |
|
8,187 |
|
4,710 |
|
|
d. |
Number of approvals |
|
5,646 |
|
4,055 |
|
|
e. |
Average size of approvals |
|
1.41 |
|
1.50 |
|
| # |
f. |
Average loan-to-value ratio (%) |
|
60.20 |
|
58.06 |
|
| # |
g. |
Average contractual life (months) |
|
227.00 |
|
217.00 |
|
| # |
h. |
Owner-occupied properties (%) |
|
99.47 |
|
99.23 |
|
|
|
|
|
|
|
|
|
|
|
By Property age |
|
|
|
|
|
|
|
Property age - 15 years or below |
- amount |
6,913 |
|
5,193 |
|
|
|
|
- number |
4,762 |
|
3,268 |
|
|
|
Property age - above 15 years |
- amount |
1,065 |
|
886 |
|
|
|
|
- number |
884 |
|
787 |
|
|
|
Associated with co-financing
schemes |
|
|
|
|
|
|
|
- amount |
|
1,403 |
|
375 |
|
|
|
- number |
|
929 |
|
208 |
|
|
|
|
|
|
|
|
|
| 3. |
New loans approved during
month |
|
but not yet
drawn |
|
|
|
|
|
|
|
|
|
a. |
Amount of approvals |
|
5,244 |
|
3,731 |
|
|
b. |
Number of approvals |
|
3,720 |
|
2,516 |
|
|
|
|
|
|
|
|
|
| 4. |
Amount of
outstanding loans |
|
|
|
|
|
|
|
|
|
a. |
Amount of loans |
|
451,828 |
|
450,124 |
|
|
b. |
Monthly change in loans |
|
0.37% |
* |
0.64% |
|
|
c. |
Twelve-month change in loans |
|
9.5% |
* |
12.1% |
|
|
d. |
Average monthly changes over |
|
|
|
|
|
|
|
last three months (annualized) |
|
7.4% |
* |
9.1% |
|
|
|
last twelve months (annualized) |
|
9.4% |
* |
12.0% |
|
|
|
|
|
|
|
|
|
|
|
Associated with co-financing
schemes |
|
|
|
|
|
|
|
- amount |
|
22,214 |
|
21,450 |
|
|
|
- number |
|
10,537 |
|
10,001 |
|
|
|
|
|
|
|
|
|
|
# |
Delinquency ratio
(%) |
|
|
|
|
|
|
|
- more than 3 months |
|
0.53 |
|
0.44 |
|
|
|
- more than 6 months |
|
0.16 |
|
0.12 |
|
|
|
|
|
|
|
|
|
| 5. |
Interest margin
on new loans approved during month |
|
|
|
|
|
|
|
|
|
a. |
At BLR |
|
0.3% |
|
0.6% |
|
|
b. |
More than 0% and up to 0.25% above BLR |
|
2.7% |
|
0.5% |
|
|
c. |
More than 0.25% and up to 0.5% above BLR |
|
21.9% |
|
6.9% |
|
|
d. |
More than 0.5% and up to 0.75% above BLR |
|
34.4% |
|
25.4% |
|
|
e. |
More than 0.75%and up to 1% above BLR |
|
17.6% |
|
27.2% |
|
|
f. |
More than 1% above BLR |
|
15.3% |
|
29.7% |
|
|
g. |
Others |
|
7.8% |
|
9.7% |
|
|
|
|
|
|
|
|
|
| * |
Adjusted for the effect of sale and purchase of
mortgage loans |
|
by a number of institutions amounting to -$17
million. |
| # |
Statistics collected from June 1998 onwards. |
|
|
|
|
|
|
|
|
RESIDENTIAL MORTGAGE LOANS IN HONG KONG
(33 institutions)
GROSS NEW LOANS MADE DURING THE MONTH
NEW LOANS APPROVED DURING MONTH
NEW LOANS APPROVED BUT NOT YET DRAWN
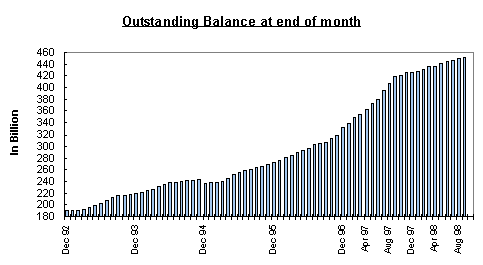
Remarks: The significant fall of outstanding balance in
December 1994 was due to the effect of reclassification,
securitization and sale of loans by some institutions.