Statistics suggest that the current financial crisis is the worst in many years.
I started my public-service career as a statistician in the Census and Statistics Department. One of my first tasks was the compilation of the national accounts for Hong Kong. These include the well-known Gross Domestic Product (GDP), which is one measure of the level of activity of the economy. I worked on that and other statistical projects at the Department for about five years before being transferred to the then Government Secretariat as an economist.
One important challenge in analysing economic statistics is to identify turning points. While it is easier to do this when dealing with statistics referring to a particular point in time, for example the unemployment rate, it is more difficult if they refer to a particular period of time, for example, the GDP. To help solve this problem, statistics for a shorter period, such as the GDP for each quarter rather than year, are prepared. But anyone looking at statistics for shorter periods should be alert to the possibility of the seasonal characteristics of the underlying economic activity: a seasonal decline should not be treated as a broad economic downturn. To get around this problem, seasonally adjusted statistics are produced. Alternatively, one can make year-on-year comparisons of the quarterly numbers. For example, when the year-on-year rate of increase in GDP for the fourth quarter is higher than that for the third quarter, it is possible that the growth rate of the economy has picked up. But more often than not the seasonally adjusted figures are not totally reliable, otherwise one could simply compare two quarterly figures and come to a conclusion quickly.
Again, to address this issue, there is the concept of annualising the quarterly or monthly changes to make the short-term changes more comprehensible. A quarter-on-quarter increase of 1% is equivalent to an annual rate of increase of 4% (4.06% to be a little more precise), and the more accurate interpretation should be: if the rate of increase in, say, the GDP in the fourth quarter of the year (compared with the third quarter) is sustained for a year, the annual growth rate of the GDP would be 4%. Alternatively, one can say that the pace of growth of the economy, measured by the GDP, in the fourth quarter was 4% per annum, bearing in mind that statistics for shorter periods, even if they are seasonally adjusted, tend to have a larger margin of error.
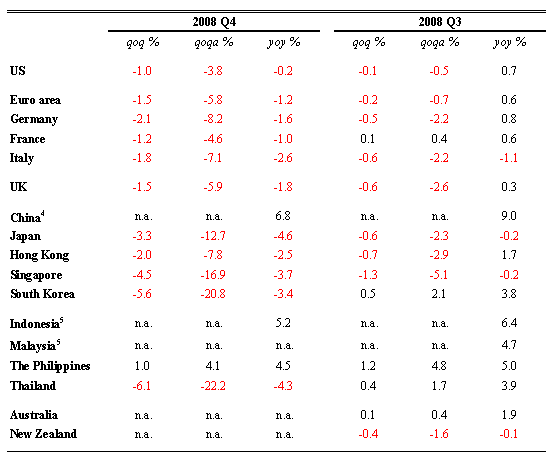
When looking at economic statistics, the first thing I almost always do is to find out whether they are seasonally adjusted, and I will annualise the latest short-term rate of change rather than look at the year-on-year comparisons that are traditionally announced in press releases. The attached table presents the latest GDP statistics for key economies in the world and in this region. It gives some indication of how severe the current economic downturn is. Clearly, this is the worst crisis in many years, and Hong Kong cannot be immune from it. While it is true that the Mainland economy, which continues to enjoy positive growth, provides Hong Kong with a cushion, the external orientation of our economy makes us very exposed to the troubles the rest of the world is suffering. I would advise everybody to hold tight and fasten their safetybelts.
Real GDP growth rates of selected economies1,2,3

- All figures are rounded to one decimal place.
- The annualised GDP growth rates of the US, Euro area, Germany, France, Italy, UK, Hong Kong, South Korea, the Philippines, Thailand, Australia and New Zealand are calculated from the more precise quarter-on-quarter growth rates. The quarter-on-quarter growth rate of Singapore is derived from the official annualised figures.
- Quarter-on-quarter GDP growth rates and their annualised figures are seasonally adjusted.
- Only year-on-year GDP growth rate is available.
- Year-on-year GDP growth rates are used because seasonally adjusted figures are not available.
n.a. = not available
Sources: Bloomberg, CEIC, national sources and HKMA staff estimates.
Joseph Yam
26 February 2009
Click here for previous articles in this column.
Document in Word format


