(Adapted from remarks by Norman Chan, Chief Executive, Hong Kong Monetary Authority, at “Fostering a Dynamic Global Economy,” a symposium sponsored by the Federal Reserve Bank of Kansas City, at Jackson Hole, Wyoming, on 24 - 26 August 2017)
It has become almost a ritual for me to make a trip to Jackson Hole, Wyoming, in late August every year. Unlike most visitors, I am not there to explore the awesome beauty of the Grand Teton National Park, but rather to attend a small annual gathering of central bankers, academics and financial market participants at the Economic Policy Symposium organised by the Federal Reserve Bank of Kansas City. While participation at the Symposium is limited to slightly more than 100 people to foster free and interactive discussions, it has always attracted worldwide media attention due to the high profile of central bank governors making public speeches on monetary policy related issues. This year, the theme of the Symposium was “Fostering a dynamic global economy” and I was invited to join an overview panel in the final session of the Symposium. There I talked about some good, not-so-good and bad news on global economic developments over the past several decades. These developments are also relevant to our society in Hong Kong and I would like to share them with readers here.
Growth in Global Economy and Income has been Significant
First, the good news. There has been a significant increase in global income over the past three-and-a-half decades. Based on the International Monetary Fund’s (IMF) estimates, PPP-adjusted per capita GDP in advanced economies (AEs) increased by 3.5 times from just US$10,100 in 1980 to US$45,700 in 2015, while growth in per capita income in emerging market economies (EMEs) has been even more impressive, surging by almost 6 times from US$1,500 to US$10,600 over the same period. I believe we would all agree that, in aggregate terms, the world economy has done not too badly, especially for the EMEs. In China, for example, over 700 million people were lifted out of poverty – an amazing accomplishment in human history. There is also little disagreement, at least among the academia and finance officials present at the Symposium, that free trade, open markets, globalisation and free movement of capital have contributed significantly to the growth of income and well-being of people, while also narrowing inequality between AEs and EMEs, in the last few decades.
But the Share of Labour Income has been on the Decline
Yet, there is some not-so-good news: while inequality across countries has narrowed, income inequality has nevertheless widened within many countries. We are witnessing rising public discontent that the gains from economic growth have failed to trickle down to the lower parts of the income distribution, particularly in AEs, as seen by voters’ recent backlashes that fuelled the populist surge in the US and Europe. Such grievances are not without grounds. Indeed, data suggest that there has been a decline in labour share of income over this period of economic growth. In the US, for example, the GDP share of labour income has fallen from 65% in 1960 to 60% in 2014 (Chart 1). At the same time, the fall in labour share of income is also quite pronounced in EMEs.
Chart 1. US share of labour income has been declining
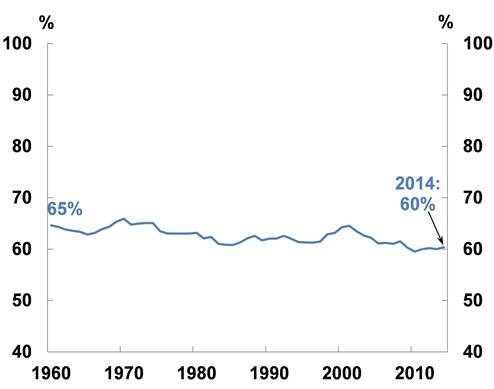
Source: Penn World Table 9.0.
There are different narratives on why the labour share of income has declined while the capital share of income has risen. It is increasingly important that we understand the causes of this decline in labour share of income. There is a worrying trend, in some places, that the decline in labour share of income (or a slower growth of per capita labour income) is taken out of context to lend support to the populist agenda of anti-trade and anti-globalisation politicians, under which protectionist slogans – such as those claiming to stop EMEs from “stealing” manufacturing jobs – have escalated from mere rhetoric to election pledges in some AEs. In the case of the US, such protectionist agenda may even find its way into mainstream politics.
Why then are workers getting a shrinking slice of the economic pie over time? Chart 2 illustrates the findings of an IMF study published in April this year on factors contributing to the decline in labour share of income. Based on this study, technological advancements explained almost 50% of the decline in labour share of income in AEs, whereas participation in global value chains accounted for only 18%. As a matter of fact, this study shows that EMEs actually suffered a bigger fall in labour share of income than AEs (with globalisation accounting for the bulk (83%) of this decline), which reinforces my view that EMEs such as China have been picked upon as a convenient scapegoat.
Chart 2. Contribution of globalisation and technological advancements to reduction in labour share of income in AEs and EMEs (1993 – 2014)
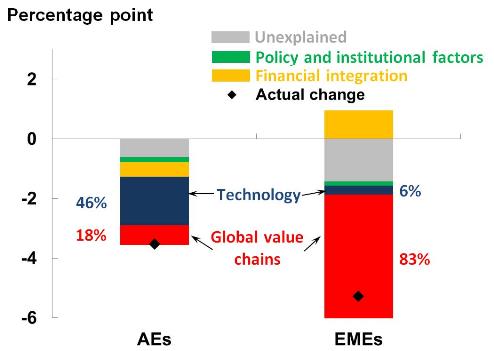
Source: IMF World Economic Outlook (April 2017).
Then there is the question of why it is technology and innovation, commonly regarded as positive developments, that have contributed to this decline in labour share of income. In this Symposium, a speaker presented a chart showing the steady decline in manufacturing employment in the US, while the value of manufacturing production has remained rather stable as a share of real GDP since 1960. It is worth noting that this trend of declining manufacturing employment had started long before China joined the World Trade Organisation (WTO) and became a major manufacturing country. As such, the increase in US manufacturing productivity could more likely be explained by technological innovation than the rise of China as a manufacturing hub.
There is clearly a need for all of us to understand more on how technological innovation would affect employment and distribution of income. There are different kinds of technologies, some labour-augmenting but others labour-substituting, examples of the latter being robotics and artificial intelligence. Moreover, the same technology may have rather different impact on AEs as compared with EMEs. For example, I can envisage the labour-substituting impact of e-commerce and internet shopping on AEs with well-established retail distribution channels through shopping malls and other shops. However, e-commerce may actually generate more jobs than it destroys in economies like China, where the conventional retail distribution channels are much less well-developed.
Distribution of Wealth is Becoming More Uneven
After the not-so-good news comes the bad news. Based on US wealth data by Emmanuel Saez and Gabriel Zucman (2016) (Chart 3), one can see that in the half-century since 1960, the wealthiest 10% of US households’ share of wealth stock increased by 4 percentage points, from 73% to 77%, which is not surprising if one bears in mind the rising share of capital income over the same period. However, the astonishing point surfaces if one breaks down the distribution of wealth amongst the top 10%, as shown in the table beneath the chart. The top 0.1% (or 160,000 tax-paying households owning US$20 million or more of net assets) share of wealth increased by a staggering 12 percentage points over this period, mostly since 1990. The next 0.9% registered a modest 1% rise, whereas the next 9% actually suffered a big fall in the share of wealth by 9 percentage points.
Chart 3. US wealth has become increasingly concentrated in the top 0.1% households
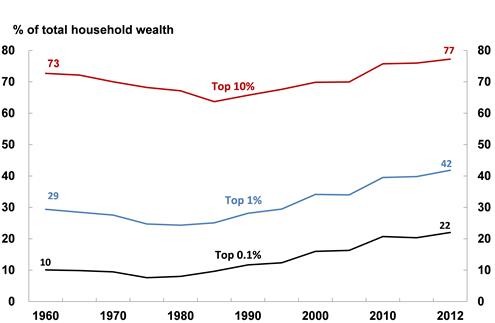
Source: Saez and Zucman, UC Berkeley (2016).
Share of US Total Household Wealth
|
|
1960
|
1990
|
2012
|
Change (1960-2012)
|
|
|
(%)
|
(%)
|
(%)
|
(Percentage pt.)
|
|
Top 0.1%
|
10
|
12
|
22
|
+12
|
|
Next 0.9%
|
19
|
16
|
20
|
+1
|
|
Next 9%
|
44
|
38
|
35
|
-9
|
What matters here is the likelihood that the combination of falling labour share of income, uneven distribution of income and increasing concentration of wealth in the hands of very few people would make more and more people become aggrieved and even angry because they have been left behind. Many of them have turned to the extreme right or extreme left which promises change, for better or worse. Such a political and social environment may also lower economic growth and some recent studies do suggest inequality makes growth less sustainable.
Unconventional Monetary Policies may have Significant Impact on Distribution of Income and Wealth
Are there more near-term causes of rising global inequality? Some argue that it is related to the implementation of unconventional monetary policies (UMPs), which is a rather contentious point. After the Global Financial Crisis, UMP including zero interest rate policy and quantitative easing (QE) by major central banks have been designed to support economic recovery and employment by lowering borrowing costs and supporting asset prices. Rich people tend to own more assets such as stocks and properties, while poor people tend to have less or none. Retirees and pensioners usually depend a lot on interest income from their savings. While many borrowers have benefitted from very low interest rates, there are also many people with deposits and lifetime savings who would lose out as they received no or meagre interest income. Stock prices and property values in some AEs and EMEs have kept on reaching record highs, thereby benefitting the rich people enormously. The widening of the already wide gap between the “haves” and “have-nots” has, to varying degrees, provided impetus to the populist movements in some AEs in pursuit of their anti-trade, anti-globalisation and anti-establishment agenda.
While research on the nexus between UMP and wealth inequality is at its infancy, a number of recent studies lent support to this view. For example, findings of a 2016 paper by the Bank for International Settlements suggest that UMP might have had significant effects on the dynamics of wealth inequality through changes in equity returns and house prices. Nonetheless, more research effort is needed on this very important subject. To conclude, central bankers, economists and policy makers will need to study and understand a lot more on the distributional effects of UMP, so that a more balanced analysis of the costs and benefits of such policies can be undertaken.
Norman Chan
Chief Executive
Hong Kong Monetary Authority
6 September 2017